Digital Forensics:SRUDB.dat
System Resource Utilization Monitor (SRUM) was introduced in Windows 8 and Windows Server 2019 and was designed to track the utilization of various system resources such as CPU usage, network activity, and even battery consumption. Some of the details collected as part of SRUM can be viewed in the App History tab within Task Manager, but there is much more information not displayed in the GUI
- SRUM data is stored in a Windows ESE database located in the following file: %SYSTEMROOT%\System32\ sru\SRUDB.dat
- SRUM is only available on Windows 8 and later and Windows Server 2019 and later
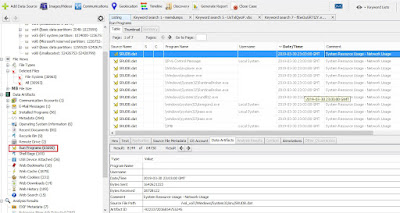
Figure Output of running Autopsy against the Run Programs > Data Artifacts
SRUM tracks key information regarding application execution such as the name and path of every executed application on the system and the SID of the identity that executed the application, even if the application has since been deleted
SRUM, or System Resource Utilization Monitor, is a feature of modern Windows systems , intended to track the application usage, network utilization and system energy state.
Download Eric Zimmerman's Tools
running SrumECmd against the location where these files reside:
SrumECmd version 0.5.1.0
Author: Eric Zimmerman (saericzimmerman@gmail.com)
https://github.com/EricZimmerman/Srum
Examples: SrumECmd.exe -f "C:\Temp\SRUDB.dat" -r "C:\Temp\SOFTWARE" --csv
"C:\Temp\"
SrumECmd.exe -f "C:\Temp\SRUDB.dat" --csv "c:\temp"
SrumECmd.exe -d "C:\Temp" --csv "c:\temp"
Short options (single letter) are prefixed with a single dash. Long
commands are prefixed with two dashes
sage:
SrumECmd [options]
ptions:
-f <f> SRUDB.dat file to parse
-r <r> SOFTWARE hive to process. This is optional, but
recommended
-d <d> Directory to recursively process, looking for
SRUDB.dat and SOFTWARE hive. This mode is primarily
used with KAPE so both SRUDB.dat and SOFTWARE hive
can be located
--csv <csv> (REQUIRED) Directory to save CSV formatted results to. Be sure
to include the full path in double quotes
--dt <dt> The custom date/time format to use when displaying
time stamps. See https://goo.gl/CNVq0k for options
[default: yyyy-MM-dd HH:mm:ss]
--debug Show debug information during processing [default:
False]
--trace Show trace information during processing [default:
False]
--version Show version information
-?, -h, --help Show help and usage information
Command
#C:\Users\...\Downloads\SrumECmd>SrumECmd.exe -f "C:\VM\...\AD01\0001\Exp
ort\srudb.dat" --csv "C:\VM\...\AD01\0001\Export\temp"
Examine output in Timeline Explorer!
System Resource Utilization Monitor artifacts :- SRUM Application Resource Usage
- SRUM Network Connections
- SRUM Network Usage
- SRUM Push Notification Data
- SRUM Energy Usage
Windows artifacts
Refer:
หมายเหตุ:เนื้อหาในเว็บไซต์นี้มีขึ้นเพื่อวัตถุประสงค์ในการให้ข้อมูลและเพื่อการศึกษาเท่านั้น ช่วยเตือนความจำ
* หากมีข้อมูลข้อผิดพลาดประการใด ขออภัยมา ณ ที่นี้ด้วย รบกวนแจ้ง Admin เพื่อแก้ไขต่อไป
ขอบคุณครับ
#WINDOWSFORENSIC #COMPUTERFORENSICS #DFIR #FORENSICS #DIGITALFORENSICS #COMPUTERFORENSIC #INVESTIGATION #CYBERCRIME #FRAUD


No comments:
Post a Comment